
Earlier this month, the U.S. Department of Agriculture updated its plant-hardiness-zone map for the U.S. for the first time in more than a decade. The new map appears to reflect a warming climate, as one might expect, and the change has received some media attention.
According to the University of Arkansas System’s Division of Agriculture, however, the increased temperatures reflected on the update map are not a reason for anyone to “freak out.”
“Looking at the river adjacent counties (Mississippi, Crittenden, etc), the new map bumped those counties squarely into a zone 8a, where they were previously a zone 7b,” said Anthony T. Bowden, an assistant professor of horticulture at the University of Arkansas. “The minute change in the classification of these counties is negligible, and I would say that producers in that area would hardly notice the difference. Additionally, Little Rock saw no change in the hardiness zone as Little Rock was squarely an 8a in 2012 as it is in the 2023 updated map.”
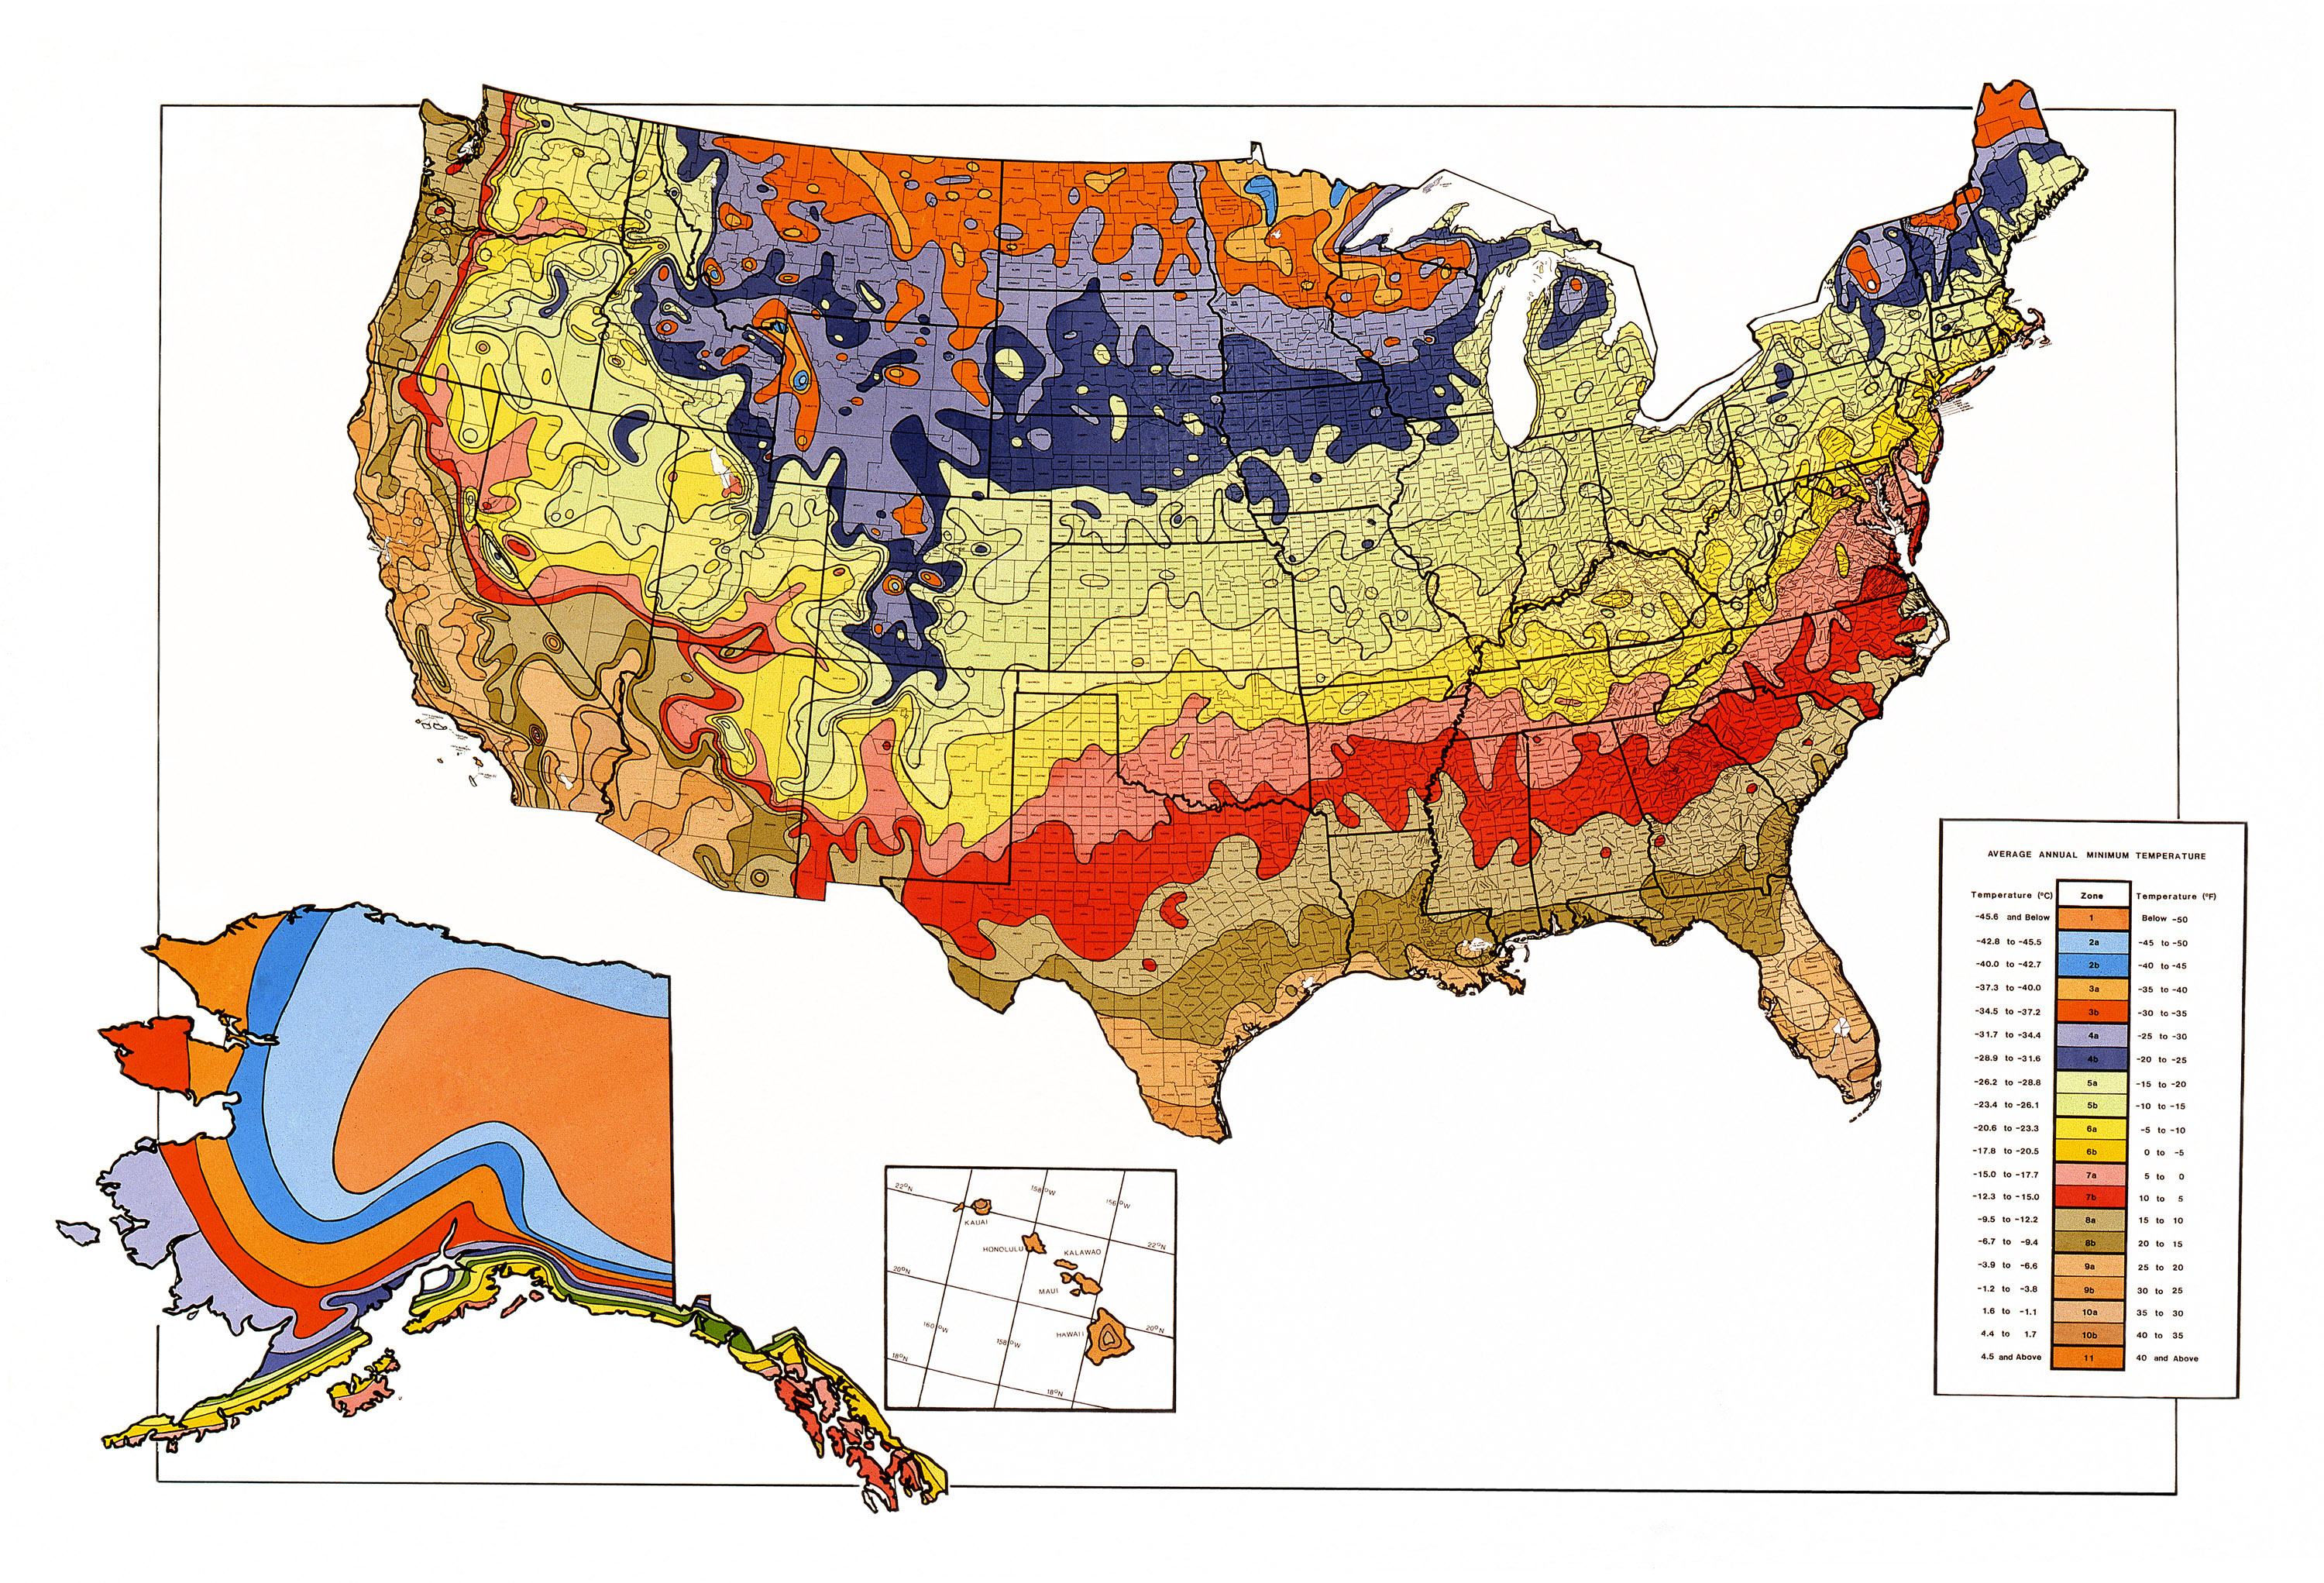
Originally mapped by the USDA in 1960, hardiness zones divide the United States into 13 regions based on the average minimum temperatures for each. The 13 regions each reflect a 10-degree range and are subdivided into two 5-degree sub-regions, labeled as (for example) “7a” and “7b.” The USDA updated these zones in 1990 and again in 2012.
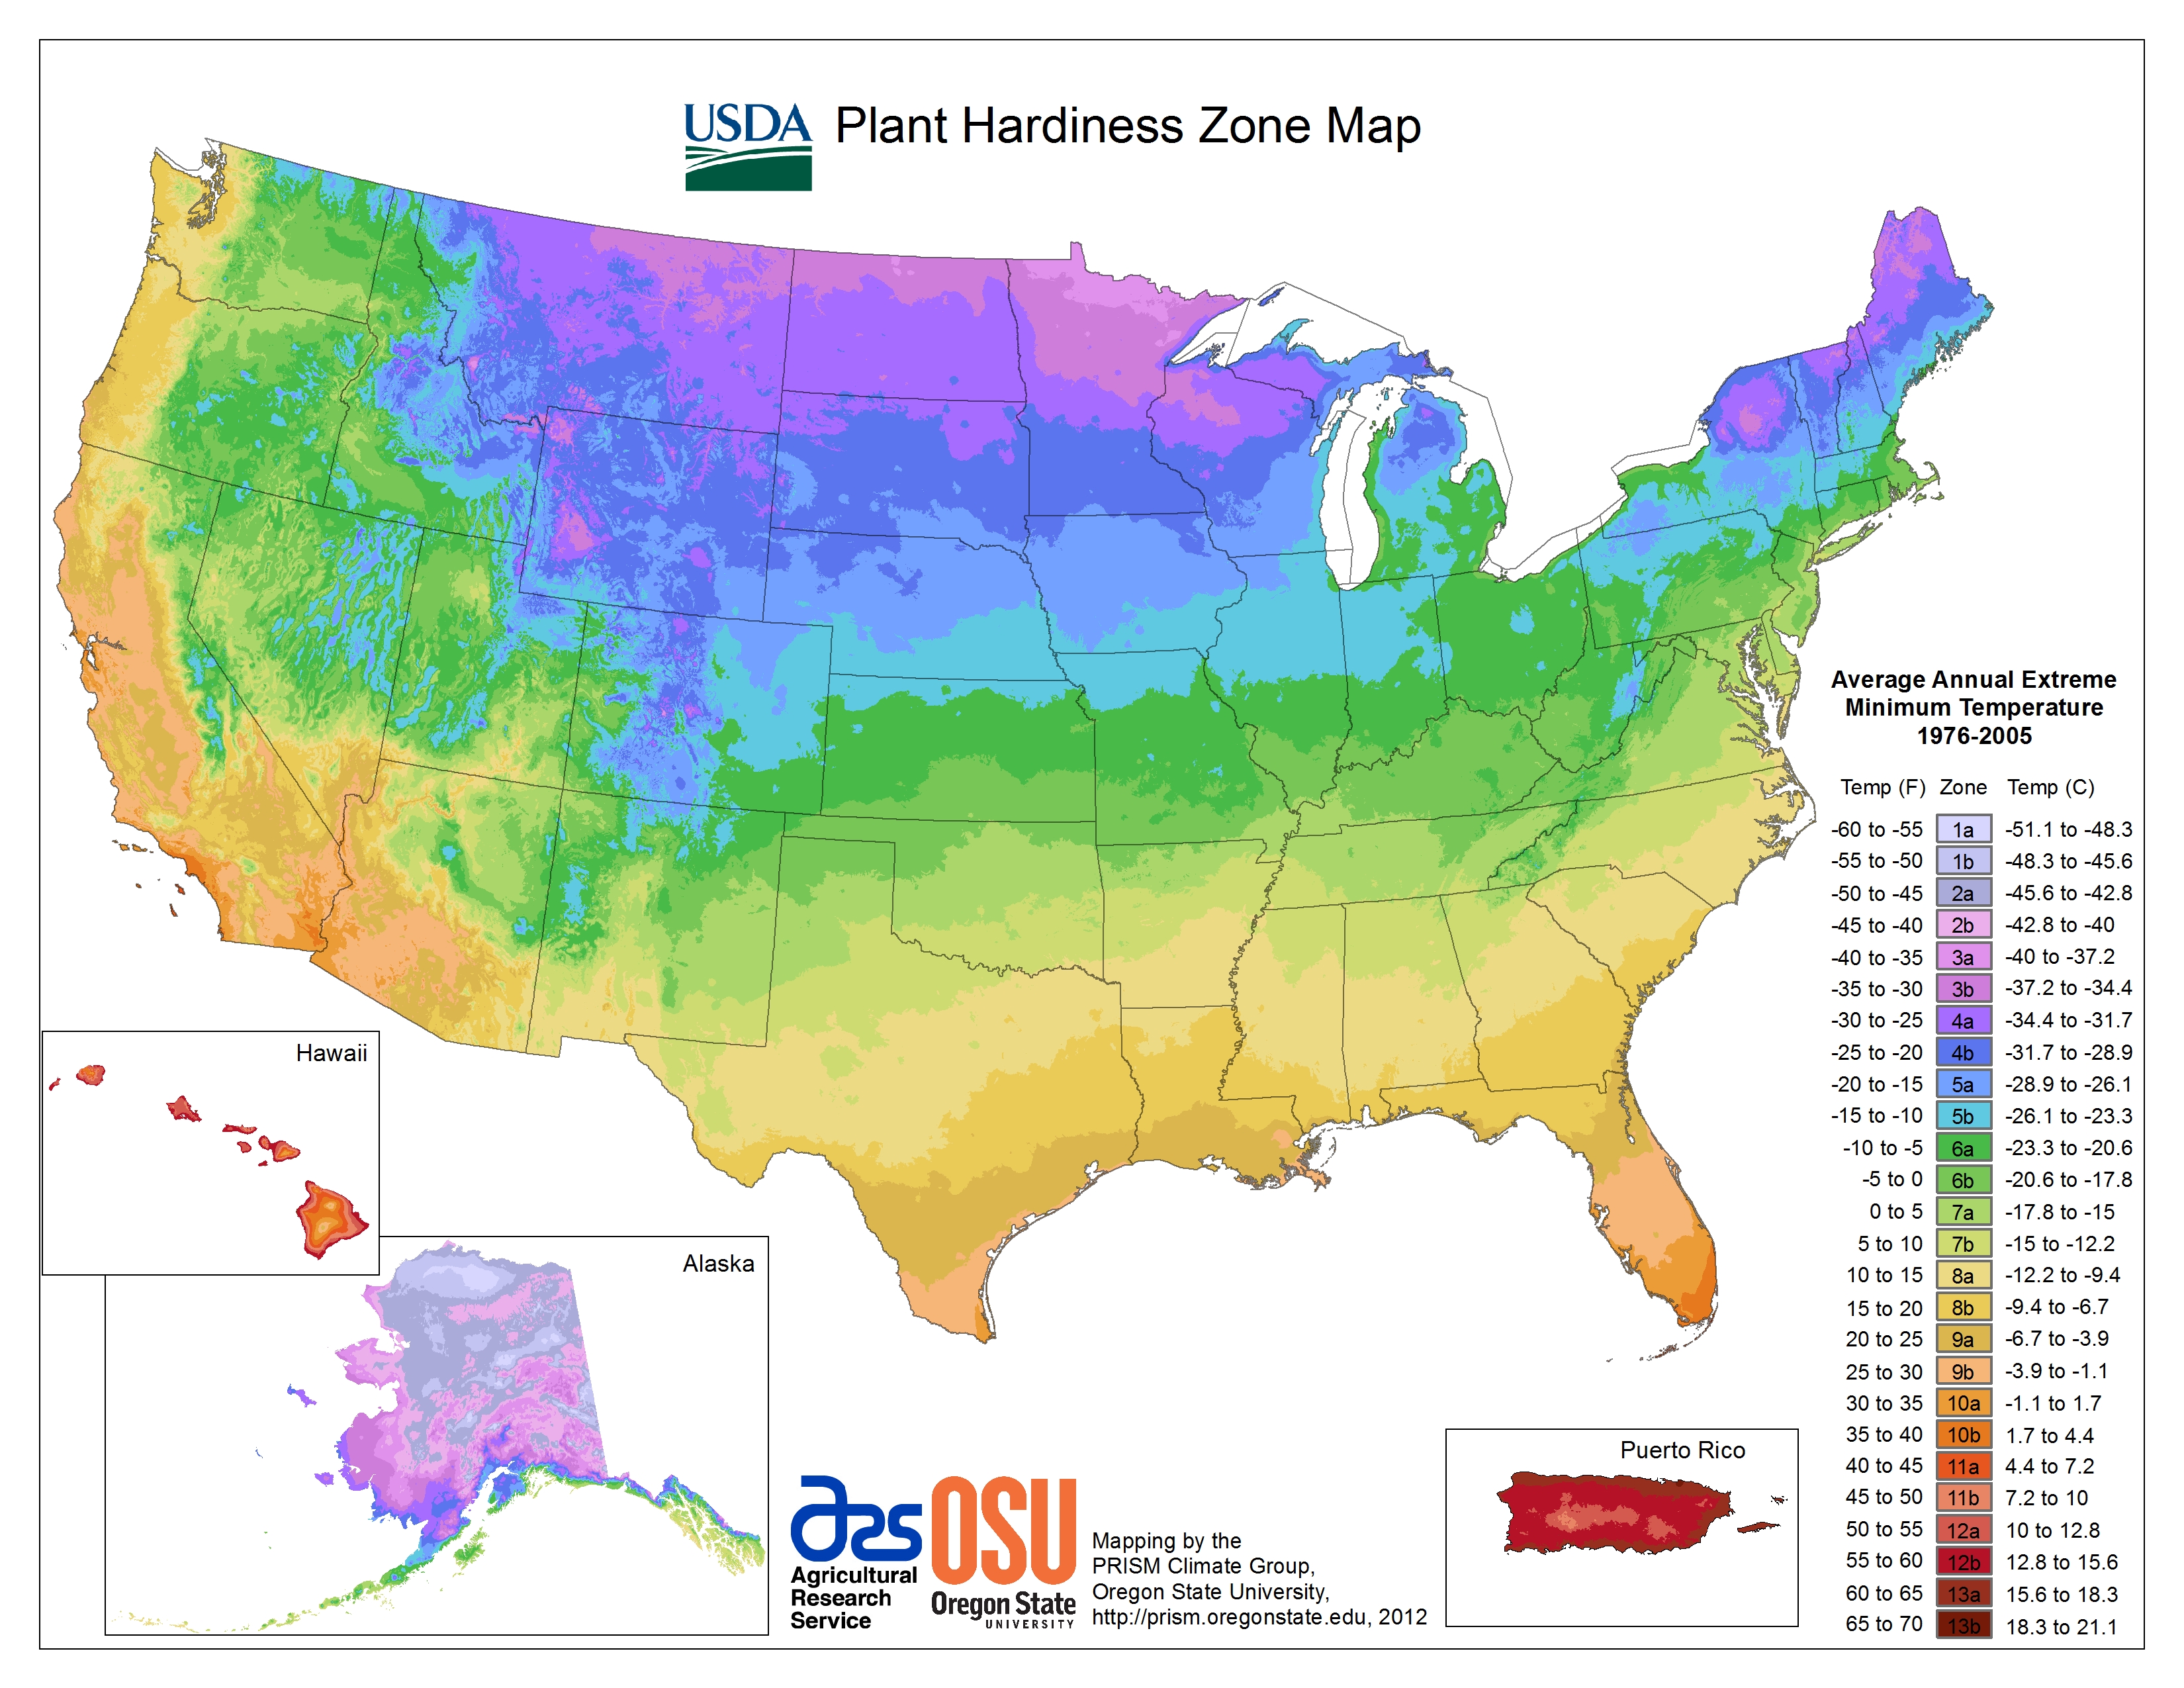
Previously, the zones in Arkansas ran from 6b in Northwest Arkansas to 8a down in the Delta. In the updated map, Northwest Arkansas is now solidly in zone 7a, and nearly in 7b, while zone 8b – which previously stopped just south of the Arkansas-Louisiana border – now extends all the way into Lonoke County.

Bowden said these maps are simply a reflection of more granular data and more accurate measurements. “The temperature updates seen in this updated version of the map are based on the increasingly sophisticated mapping methods and the inclusion of data from more weather stations,” he said. There were 7,983 stations used for the 2012 map, Bowden explained, compared to 13,412 for the 2023 map.
For each of these 13,412 stations, researchers averaged the lowest single temperature for each year from 1991 through 2020, and these average lows were used to create the zones in the updated map. Compared to the 2012 map, the 2023 map reflects a 2.5-degree increase in average low temperature in the U.S.
But scientists caution that the increase is not necessarily driven by climate change. “The addition of many new stations and more sophisticated mapping techniques using the latest PRISM technology led to a more accurate and detailed Plant Hardiness Zone Map, but also produced localized changes that are not climate-related,” explained Christopher Daly, lead author of the updated map.
Ultimately, Bowden said these new maps should not cause heartburn for local gardeners.
“Speaking strictly in terms of ornamental plants, the changes seen in Arkansas to the map update are negligible,” he said. In other words, “Plants that were growing in people’s yard three weeks ago will still continue to grow today.”